
[Everything About Drone Batteries]Part 2: Key Indicators Determining Flight Performance: Discharge Rate (C-Rating) and Internal Resistance (IR)
Hello to all the graduate students and researchers dedicating yourselves to the research and development of drones and next-generation air mobility (UAM, eVTOL)! In Part 1, we covered the foundational Series/Parallel (S/P) architecture of drone batteries and compared the chemical characteristics of LiPo and Li-Ion cells.
Today, we will dive deep into the hidden truth behind the numbers listed on a battery datasheet. We will uncover the myths and realities of the ‘Discharge Rate (C-Rating)’ and explore ‘Internal Resistance (IR)’, which is the most powerful and definitive indicator for assessing a battery’s State of Health (SOH). Whether you are testing batteries in the lab or designing the propulsion system for a new UAV, understanding the physical principles of IR and learning how to simulate them using Python is absolutely essential. Let’s get started!
1. The Concept of Discharge Rate (C-Rating) and Marketing Traps
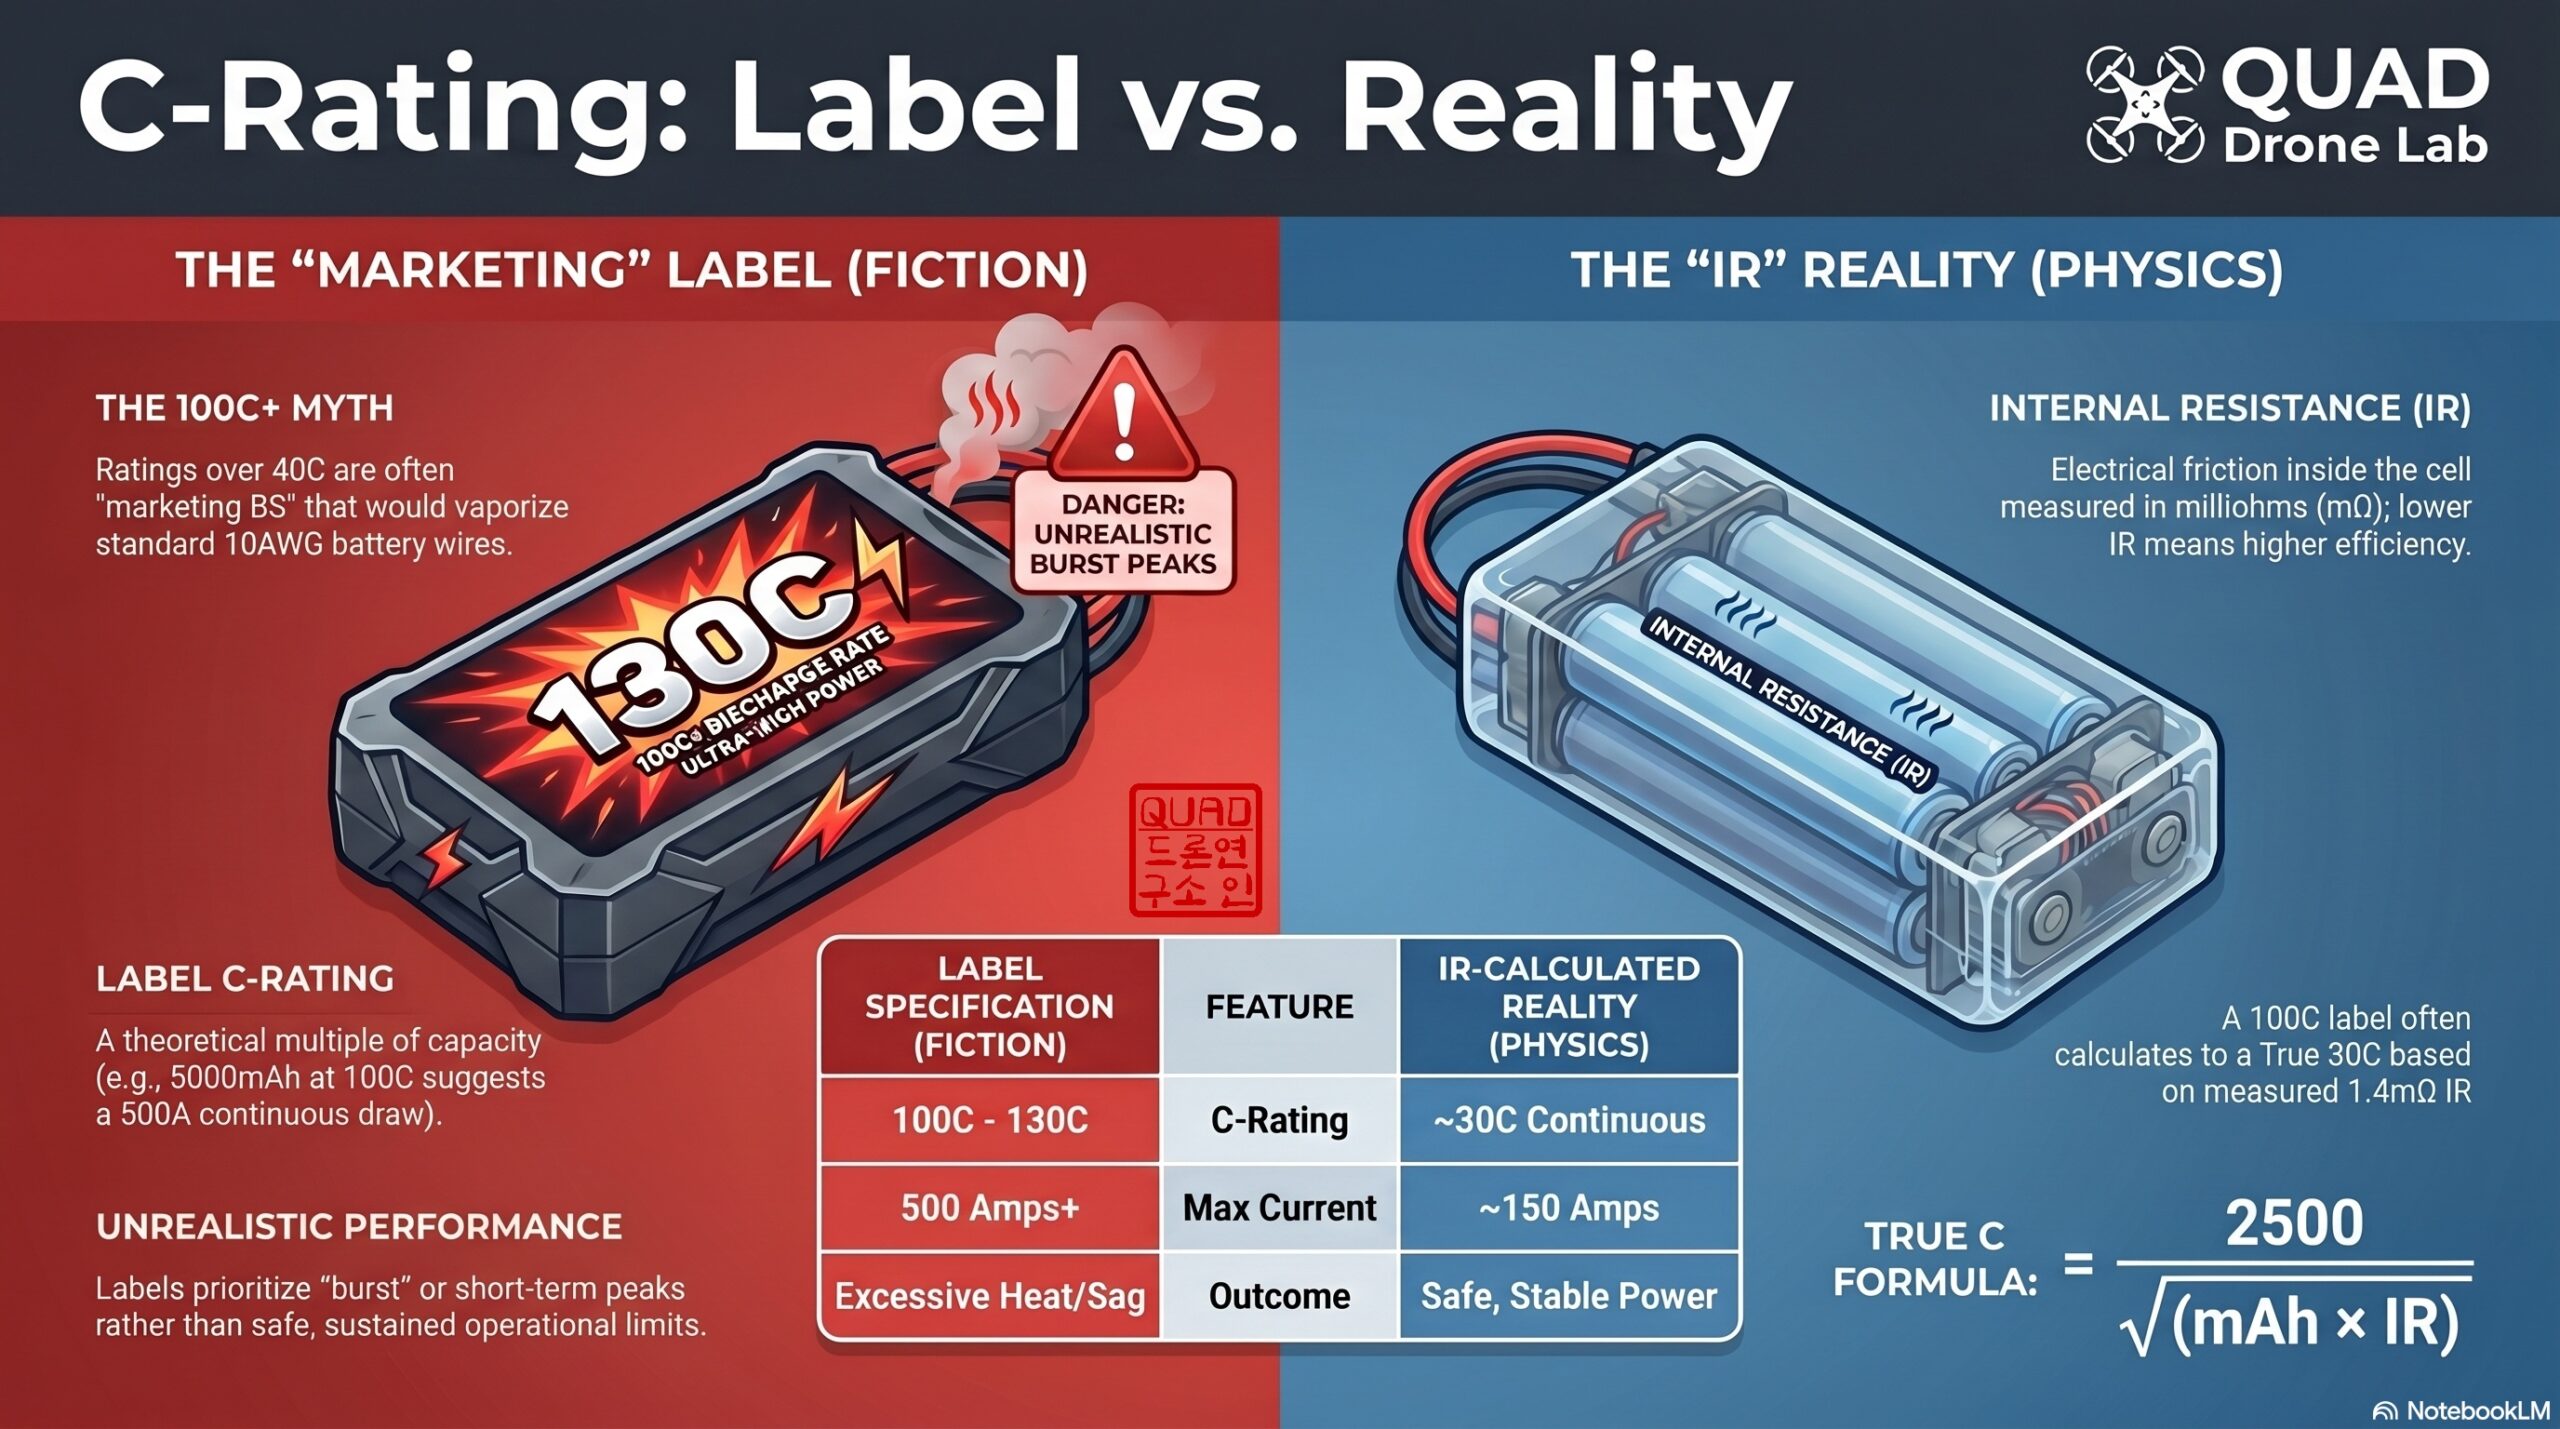
When purchasing a LiPo battery for drone research, one of the most prominent specifications you will see is the C-Rating, boasting massive numbers like ‘100C’ or ‘130C’.
The discharge rate represents the maximum proportion of current a battery can safely release without sustaining damage. The formula to calculate this is straightforward:
- Maximum Continuous Discharge Current (A) = Battery Capacity (Ah) × C-Rating
For example, a 2000mAh (2Ah) battery with a 10C discharge rating can continuously and safely output 20A of current (2Ah × 10 = 20A).

[The Trap Researchers Must Avoid] However, the vast majority of LiPo battery manufacturers in the market heavily overstate these C-Ratings for marketing purposes. An advertised continuous discharge rate of ‘100C’ or more is often entirely unrealistic. For instance, if a 5000mAh (5.1Ah) battery genuinely supported a continuous 80C discharge, it would mean pushing 408 Amps of current through the system. This amount of current would cause the standard 10 AWG wires and XT90 connectors to glow red hot and vaporize instantly. Therefore, C-Ratings of 100C+ printed on labels are either pure marketing jargon or refer only to split-second ‘burst’ peaks right before the battery gets destroyed. They should never be used as a baseline for your engineering designs.
So, how can we determine the ‘true discharge rate’ suited for our research drones? The answer lies in Internal Resistance (IR).
2. Internal Resistance (IR): Electrical ‘Friction’ and Voltage Sag
Internal Resistance (IR) acts as a form of electrical “friction” that opposes the flow of current inside the battery. When a drone rapidly accelerates (punches the throttle), the motors demand massive amounts of current. As this current forces its way through the battery’s internal resistance, inevitable physical phenomena occur.
[The Difference Between DC-IR and AC-IR (ESR)] When analyzing batteries in the lab, you must clearly distinguish between two types of resistance:
- DC-IR (Direct Current Internal Resistance): This is the “true” resistance that occurs when the drone is actually drawing power. It is calculated using Ohm’s Law (R=ΔV/I) by measuring the voltage drop under a specific physical load.
- AC-IR (Alternating Current Internal Resistance / ESR): This is the impedance value measured by smart hobby chargers (like ISDT, HOTA, etc.). The charger sends a small, high-frequency AC signal (typically 1kHz) to measure the resistance. While it is not perfectly identical to DC-IR, it serves as an excellent and consistent proxy for tracking battery degradation and State of Health (SOH).
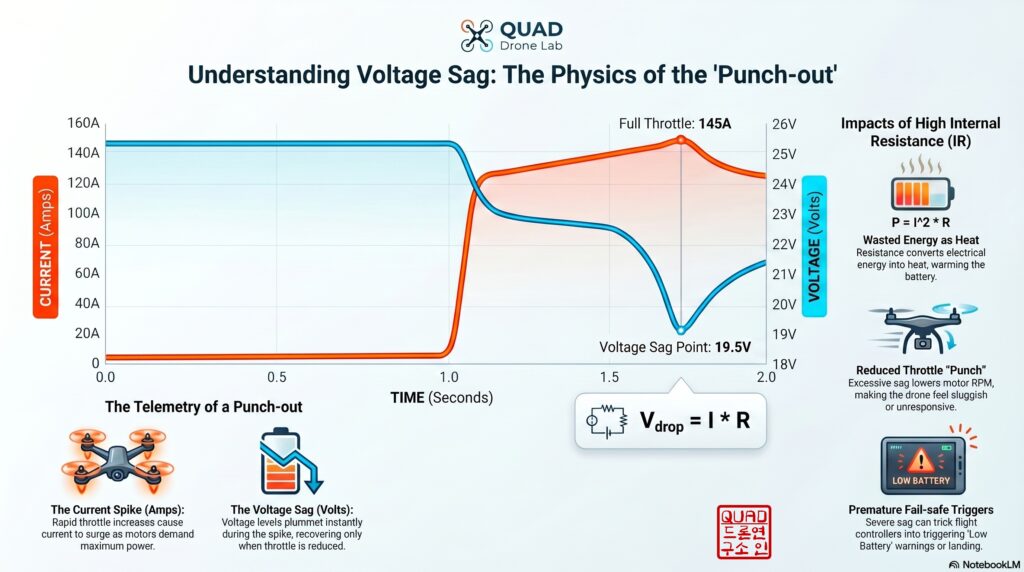
[The Voltage Sag Phenomenon] When you rapidly increase the throttle, a massive current (I) flows through the internal resistance (R), causing an internal voltage drop according to the formula Vdrop=I×R. The voltage recognized by the flight controller (FC) and motors drops by exactly this lost amount, a phenomenon known as Voltage Sag. Batteries with high internal resistance suffer from severe voltage sags under heavy loads, causing the drone to feel sluggish, prematurely triggering low-battery warnings, or even causing the Electronic Speed Controller (ESC) to cut off power entirely, which can lead to a crash.
3. The Fatal Impact of Internal Resistance on Flight Performance and Safety
Internal resistance doesn’t just reduce power output; it directly triggers critical safety hazards.
- Heat Generation and Thermal Runaway: The energy lost to internal resistance is directly converted into “heat” (P=I2×R). During high-load missions, a battery with high resistance will heat up rapidly, increasing the risk of a dangerous thermal runaway.
- Battery Swelling (Puffing): Excessive internal heat decomposes the electrolyte inside the battery, generating gas. This causes the soft pouch to swell up like a balloon, serving as a clear physical warning that the internal structure of the cell is permanently damaged.
- Reduced Flight Time: When energy is wasted as heat due to internal resistance, the actual energy available to spin the propellers decreases, ultimately leading to noticeably shorter flight times.
[Guidelines for Normal Internal Resistance Ranges] For high-capacity drone batteries commonly used in industrial or heavy-lift cinematic drones (12000mAh ~ 22000mAh), the general guidelines for per-cell internal resistance are as follows (※ Note: smaller micro-drone cells naturally have much higher baseline resistance, often exceeding 150mΩ):
- 0 ~ 1.5 mΩ: Excellent, brand-new condition (ideal for high-load, heavy-lifting missions).
- 1.5 ~ 3 mΩ: Good condition (reliable for standard professional missions).
- 3 ~ 5 mΩ: Mild degradation (voltage sag becomes noticeable under high loads).
- 5 ~ 8 mΩ: Nearing End of Life (unsafe for high loads; relegate to light ground testing).
- > 8 mΩ: Dangerous state (high risk of excessive heat and fire; immediate disposal recommended).
4. Python Simulation: Calculating Realistic C-Ratings and Voltage Sag
Among international RC communities and researchers, a widely accepted empirical formula is used to reverse-engineer a practical, safe continuous discharge rate based on measured internal resistance, rather than trusting the manufacturer’s exaggerated label.
Realistic Discharge Rate (C) = 2500 / Battery Capacity (mAh)×Highest Cell IR (mΩ)
To assist graduate students during the propulsion system design phase, I have prepared a Python script. This code takes battery specifications and charger-measured IR values to estimate the realistic maximum continuous discharge rate and simulate the expected voltage sag under a specific current load.
import math

class DroneBatteryPerformance:
    def __init__(self, capacity_mah, cell_count_s, max_cell_ir_mohm):
        """
        Class to simulate the actual performance and voltage sag of a drone battery.

        :param capacity_mah: Battery capacity in mAh
        :param cell_count_s: Number of cells in series (S)
        :param max_cell_ir_mohm: The highest internal resistance among cells in the pack (mΩ)
        """
        self.capacity_mah = capacity_mah
        self.capacity_ah = capacity_mah / 1000.0
        self.cell_count_s = cell_count_s
        self.max_cell_ir_mohm = max_cell_ir_mohm

        # Approximate total internal resistance of the pack (Sum of cell resistances)
        # Using the highest cell IR * cell count for a conservative estimate
        self.total_pack_ir_mohm = max_cell_ir_mohm * cell_count_s
        self.total_pack_ir_ohm = self.total_pack_ir_mohm / 1000.0

        self.nominal_voltage = 3.7 * cell_count_s

    def calculate_realistic_c_rate(self):
        """
        Estimates a realistic and safe maximum continuous discharge rate (C-Rating)
        based on internal resistance. (Based on RC community empirical formulas)
        """
        calc_value = math.sqrt(self.capacity_mah * self.max_cell_ir_mohm)
        realistic_c = 2500 / calc_value
        return round(realistic_c, 2)

    def calculate_max_continuous_current(self):
        """Calculates the maximum continuous discharge current (A) based on the realistic C-rate."""
        realistic_c = self.calculate_realistic_c_rate()
        max_current_a = self.capacity_ah * realistic_c
        return round(max_current_a, 2)

    def simulate_voltage_sag(self, current_draw_a):
        """
        Calculates the voltage sag of the entire pack under a specific current load (A).
        V_drop = I * R
        """
        v_drop = current_draw_a * self.total_pack_ir_ohm
        return round(v_drop, 2)


# --- Simulation Example ---

# [Scenario] A 6S 5100mAh battery with '80C' printed on the manufacturer's label.
# However, measuring with a smart charger reveals a maximum cell IR of 1.4mΩ.
battery = DroneBatteryPerformance(capacity_mah=5100, cell_count_s=6, max_cell_ir_mohm=1.4)

print("=== Drone Battery Actual Performance Simulation Results ===")
print(f"Manufacturer Marketing C-Rating: 80C (Theoretical max 408A... Unrealistic!)")

real_c = battery.calculate_realistic_c_rate()
max_amp = battery.calculate_max_continuous_current()
print(f"-> Estimated Realistic C-Rating based on IR: ~{real_c}C")
print(f"-> Safe Maximum Continuous Discharge Current: ~{max_amp}A\n")

# Assuming a load of 100A during hovering or rapid acceleration of a large drone
load_current = 100
sag_voltage = battery.simulate_voltage_sag(load_current)
operating_voltage = (4.2 * 6) - sag_voltage # Voltage drop from fully charged state (25.2V)

print(f"=== Voltage Sag Simulation under {load_current}A Load ===")
print(f"Estimated Total Pack Internal Resistance: {battery.total_pack_ir_mohm:.1f} mΩ")
print(f"Voltage Sag (V_drop): {sag_voltage}V")
print(f"Actual Output Voltage of the pack at full throttle: {operating_voltage:.2f}V (25.2V -> {operating_voltage:.2f}V)")
If you run this code, you will mathematically prove that a battery labeled as ’80C’, when reverse-engineered using its 1.4mΩ IR data, actually has a safe limit of around 29.6C (~30C), which translates to a maximum of 151A. Additionally, you can proactively predict during the design phase that applying a 100A load to this 6S pack (total resistance ~8.4mΩ) will result in a voltage sag of 0.84V.
=== Drone Battery Actual Performance Simulation Results ===
Manufacturer Marketing C-Rating: 80C (Theoretical max 408A... Unrealistic!)
-> Estimated Realistic C-Rating based on IR: ~29.59C
-> Safe Maximum Continuous Discharge Current: ~150.91A

=== Voltage Sag Simulation under 100A Load ===
Estimated Total Pack Internal Resistance: 8.4 mΩ
Voltage Sag (V_drop): 0.84V
Actual Output Voltage of the pack at full throttle: 24.36V (25.2V -> 24.36V)5. Consistency in Measurement and Proper Battery Maintenance
When tracking IR data for research purposes, the most crucial principle is controlling your measurement environment.
- Measure at a Consistent Temperature: Internal resistance is highly sensitive to temperature. Heat increases chemical reaction rates, lowering resistance, while cold temperatures cause resistance to spike. For accurate comparisons, always let the battery stabilize and measure it at room temperature (around 22°C – 25°C).
- Measure at a Consistent State of Charge (SoC): The resistance value fluctuates slightly depending on the battery’s remaining capacity. The industry standard for the most reliable measurement is to test the battery at storage voltage (~3.80V to 3.85V per cell).
- Proper Storage and Landing Practices: When flying, it is ideal to land when the resting voltage reaches 3.5V to 3.6V per cell. Over-discharging below this point permanently damages internal chemicals, causing IR to skyrocket. If you do not plan to use the battery immediately after a flight, you must use your charger’s ‘Storage Mode’ to bring the cells back to 3.80V – 3.85V and store them in a cool, dry place. This is the most effective way to prevent swelling and maximize the lifespan of your LiPo cells.
Conclusion
As we have explored today, relying solely on the printed ‘Capacity’ and ‘C-Rating’ to design your drone’s propulsion system is a critical mistake you should avoid in the lab. Internal Resistance (IR) is the transparent metric that reveals the true ‘stamina’ of a battery. Making a habit of periodically logging and managing this data will protect your expensive research drones from unexpected power failures and crashes.
In [Part 3], we will move beyond the 4S era of small drones and explore why High-Voltage Systems (6S, 8S, and 12S+) have become the mandatory industrial standard for medium-to-large UAVs, analyzing the physics behind their incredible power efficiency. Please look forward to the next installment!
YouTube Tutorial

Author: maponarooo, CEO of QUAD Drone Lab
Date: April 28, 2026
![[Everything About Drone Batteries]Part 3: The Evolution to High-Voltage Systems: The World of 6S, 8S, and 12S](https://quad-drone-lab.co.kr/wp-content/uploads/2026/05/Inside-the-Intelligence-Battery-Diagram-768x429.png)
![[PX4 Tuning Series 6] Trajectory Generator and Setpoint Tuning: The Art of Flight Feel and Smooth S-Curves](https://quad-drone-lab.co.kr/wp-content/uploads/2026/03/Drone-Trajectory-Comparison-768x429.png)
![ROS2 Mastery [Part 1] Complete Guide to ROS2 Jazzy Development Environment and Workspace](https://quad-drone-lab.co.kr/wp-content/uploads/2026/03/0330_인포그래픽-1-768x429.png)
![[PX4 Tuning Series Appendix] Racing Drone Tuning Guide (Racer Setup): Unlocking Extreme Performance](https://quad-drone-lab.co.kr/wp-content/uploads/2026/03/Racing-Drone-Minimalism-and-Balance-768x429.png)